What weather conditions can tell us about the likelihood of a successful summit.
Introduction:
Sports data and analysis has been around for decades, though its use has largely been in the realm of professional team sports rather than individuals. Mountaineering is one example of a sport that many professionals and amateurs partake in without leveraging available data. For this report we will be analyzing the available data on Mount Rainier climbing (available on Kaggle, here), looking specifically at the number of attempts, successful summits, routes taken, and a collection of weather data points for the mountain over two years.
The “Business Question”
For those (like myself) who contemplate climbing Mount Rainier, a useful question to ask is what conditions are most conducive to a successful summit? The answers to these questions could help influence one’s decision to climb under certain weather conditions, how many people to climb with, and which route to climb.
In order to answer this question quantitatively we’ll be utilizing correlation analysis and a random forest model to determine which features are most important, before moving on to Association Rule Mining to determine which conditions are most likely to result in a successful climb.
Data Exploration:
Data Preparation: Joining Weather and Climbing Data
Before getting into analysis, it’s useful to get an understanding of the central tendency and spread of our data. But before that we need to join our two data sets, climbing and weather, to have a unified data frame to run analysis on.
The two data frames both have date values, but neither in the correct format. After converting both date columns to the correct format, we see the following:
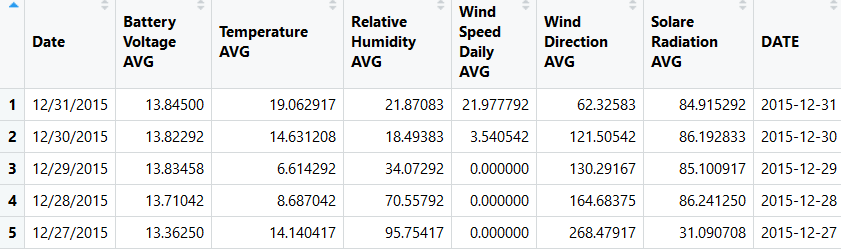
Figure 1 - Weather Data
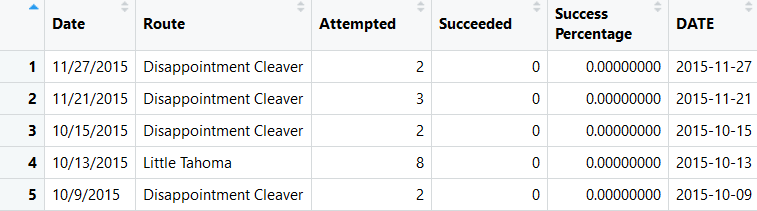
Figure 2 - Climbing Data
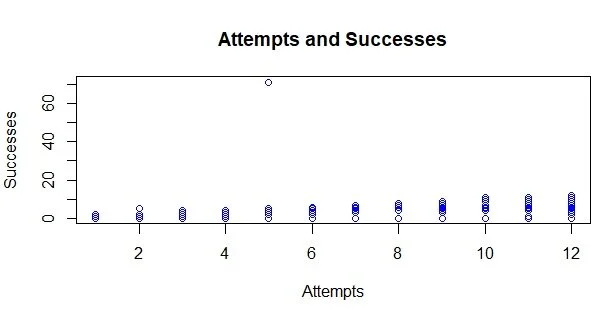
Figure 3 - Attempts and Successes
We then merge the two data frames by the column “DATE.” Now we’re ready to start exploring. In visualizing a simple scatterplot showing the number of attempts in comparison to the number of successes, we can see an outlier (Figure 3). One data point shows 5 attempts but over 70 successes—since the number of successes can not be more than the number of attempts this is clearly a data entry error, and the entire row can be removed.
Correlation Exploration
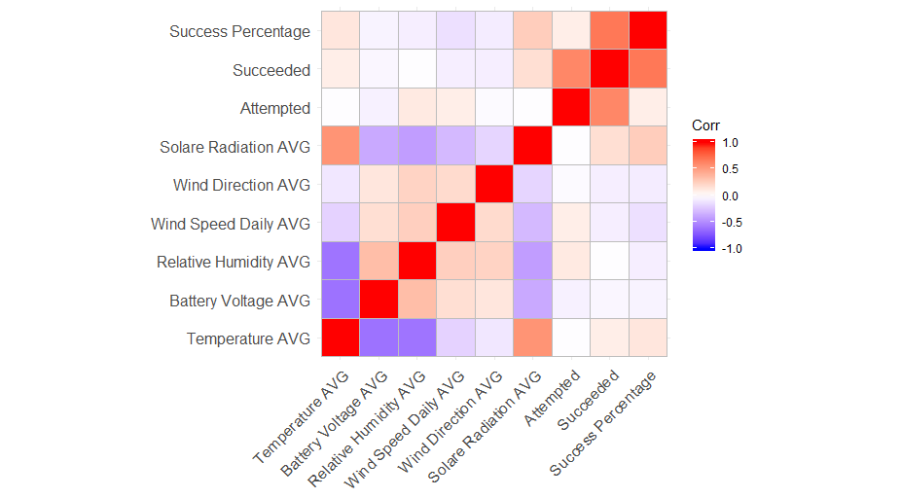
Figure 4 - Correlation Matrix
To begin to understand how these variables interact, we temporarily remove the non-numeric variables, and generate a correlation plot (Figure 4). This shows us a couple things that make intuitive sense, and a few others that give insight into our later models. Success percentage, succeeded, and attempted all have the highest correlations—which makes sense given that there can only be as many successes as there are attempts, and it makes sense that on days where a lot of people attempt a given route, most of them will either fail or succeed—rather than some fraction of them making it to the top while others are left behind. Likewise success percentage is determined by successes and attempts, so the high correlation there also makes sense. This is important for our later models, as we’ll want to remove the success metrics, and possibly the attempt metrics, in order to predict likelihood of success based on the other values.
What is interesting is that solar radiation avg. correlated relatively strongly to success percentage—indicating that the approximate temperature (see Data dictionary for longer explanation of this weather metric) correlates highly to the likelihood of success. Temperature also has a correlation to success percentage, but it is not as strong.
Random Forest:
Data Preparation: Random Forest Discretization
In order to run the data through a standard random forest model, we need to discretize success percentage to bins. For rows which saw under a 25% success rate, we categorize as low, for rows with a success rate between 25% and 75%, we categorize as medium, and for rows with over a 75% success rate we categorize as high. Then we subset the data to only those rows which were on the Route Disappointment Cleaver (this determined because 68% of rows were on this route, and so we don’t have to consider Route as another factor variable.) We also remove the success variables (Successes, Success Percentage) outside of our new binned variable, as those would result in 100% accuracy since they’re what we used to create the variable (SuccBin) we’re predicting on. Finally we split the newly subset data into a training and testing set, with a standard 75/25 split.
Model and Variable Importance
While the standard Random Forest model (see Figure 5) resulted in only a 50% training and 52% testing accuracy rate, what we’re more interested from this analysis was which numeric variables were the most important in determining success.
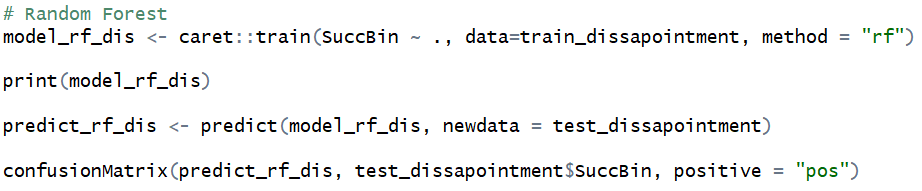
Figure 5 - Random Forest
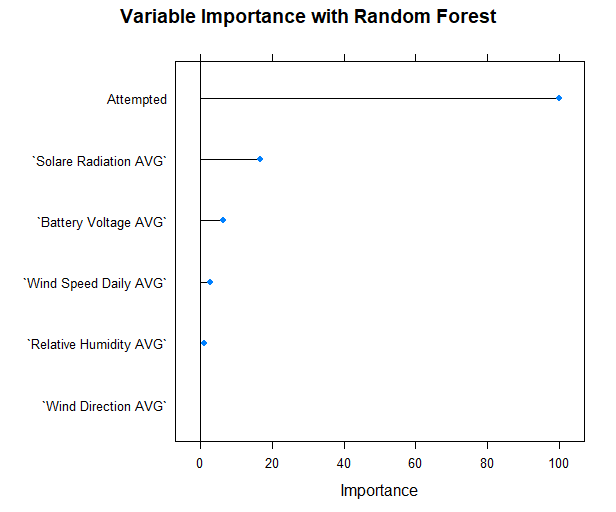
Figure 6 - Random Forest Variable Importance
Taking the random forest model and investigating the variable importance helps add to our newfound understanding of the data from the correlation matrix—and expands it. In addition to number attempted, Solare radiation and wind speed, the Random Forest variable importance chart (Figure 6) showed that Battery Voltage also was important in determining success of a climb. These are the variables we’ll be discretizing to use in the Association Rule Mining model.
Association Rule Mining:
Data Preparation: AR Mining Discretization
In order to run association rule mining, we’ll need to now convert our numeric variables to categorical ones, this discretization (done by binning) is the same as what we did for the Random Forest except across all variables we care about rather than just Success Percentage. Below is a list of the variables
Discretizing Variables:
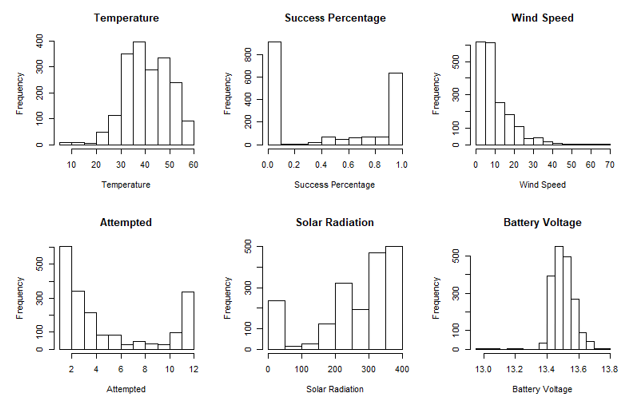
The number of bins and breaks were created by using both common knowledge (Temperature, Success Percentage, Attempted) and frequency of values. See Appendix 2 for histograms of the following six numeric variables.
Success Percentage: see above logic for Random Forest discretization
Temperature AVG: discretized to 3 groups: Freezing, Cold, and Warm based on temperature being below 32 degrees, between 34 and 45, and above 45 degrees.
Wind Speed AVG: discretized to 3 groups: Breezy, Windy, and Really Windy, based on wind speeds of between 0 and 10, 10 and 30, and above 30 mph.
Attempted: discretized to four groups: Solo, Small Group, Medium Group, and Large Group. Based on 1 attempt, between 2 and 4 attempts, between 5 and 10 attempts, and between 11 and 12 attempts.
Solare Radiation AVG & Battery Voltage AVG: both of these variables were discretized to three groups, high, middle, and low, based on bins of equal widths—determined by the min and max of each variable combined with the variable’s width.
Model Development:
Hyper Parameters:
In order to apply association rule mining to the discretized data frame, we now need to set hyperparameters, or rules by which we want the model to run by. The rules in question are support(how frequently the weather variables, group size, and success likelihood occur together in the whole dataset), confidence (how often the rule is found to be true), and lift(the ratio of the observed support to that expected if the row’s value for each variable were independent).
Support:
For support, we want to make sure the rules we are generating are useful, and do not point to small circumstances that are only represented by a few attempts on the summit. With the 1,889 records we have for group summit attempts, a safe hyperparameter would be .01, or 1% of the data set. This will only give us rules can apply to 18 or more attempts. The higher support for the rule, the more a mountaineer can use it to judge the circumstances they’re planning on climbing under. For the second model (see below) this support was lowered to .005 or .5% of the data set after trial and error.
Confidence:
For confidence, we want to be pretty confident that the rule we’re using will impact our likelihood of a successful summit. But there is variability in this dataset, especially given the different routes, so it’s important to not set our confidence hyperparameter so low that only a few uninteresting rules arise. With some trial and error we determined a confidence interval of .75, or 75% is sufficient. For the second model this confidence was lowered to .60 or 60% after trial and error.
Lift:
For lift, we want to make sure we’re only looking at rules which perform better than expected under random conditions. Any lift value greater than 1 indicates that the rule is performing better than expected, whereas a value near 1 indicates it’s working about as expected. For these reasons are going to look at the lift of each of our generated rules, sorting by lift to view only those higher than 1, which a strong preference for rules with higher values.
Model Experiments:
Terminology:
Before discussing the three models experimented with to determine the most useful rules for mountaineers, it’s useful to define some terminology. LHS is left-hand side and indicates the variables within the attempt set (collection of variable values for a given attempt record) that is the antecedent—or what values are taken to predict the consequent, or RHS (right-hand side). Further simplified, the LHS indicates characteristics of an attempt which can be used to predict the RHS for future attempts.
Models:
With the same hyperparameters listed above, we ran three different models to find rules to further investigate. The first model ran on the wholeclimbing and weather data set with no preference for the type of rules generated. This means that the RHS had no boundaries set on it and could be anything.
The second model limited the results to only those which had a RHS of SuccBin=High (the attempts in question resulted in at least 75% of the group members summitting) and the third model limited the results to only those which had a RHS of SuccBin=Low (the attempts in question resulted in under 25% of the group members summitting.)
The reasoning for limiting the second and third models to RHS’s associated with the success rate is because that is the variable that mountaineers care about in determining whether or not to climb. See Figure 7 for code of the models (after trial and error tuning).
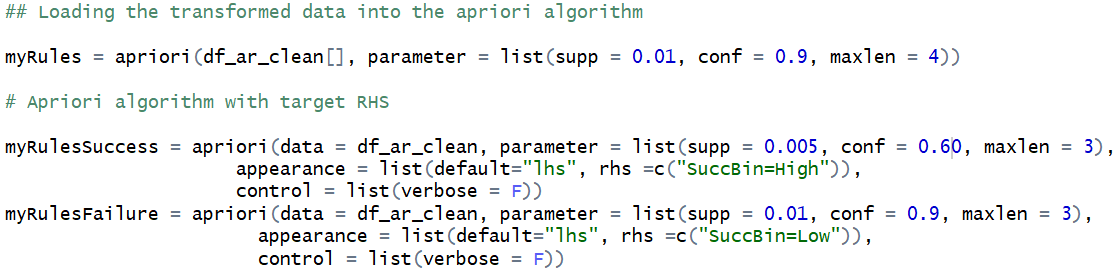
Figure 7 - Association Rule Mining Models
Results:
First Model:
The top 20 rules (with 100% confidence and support of 1-4%, Lifts of well over 2.5+) all related to varying conditions which resulted in the BatteryBin being “High Battery”, because these rules apply to voltage which incorporates many factors, but is relatively useless for mountaineers to know, these were disregarded. This further confirms the need to set the RHS to either High or Low success, because those were the areas we cared about. (Figure 8)
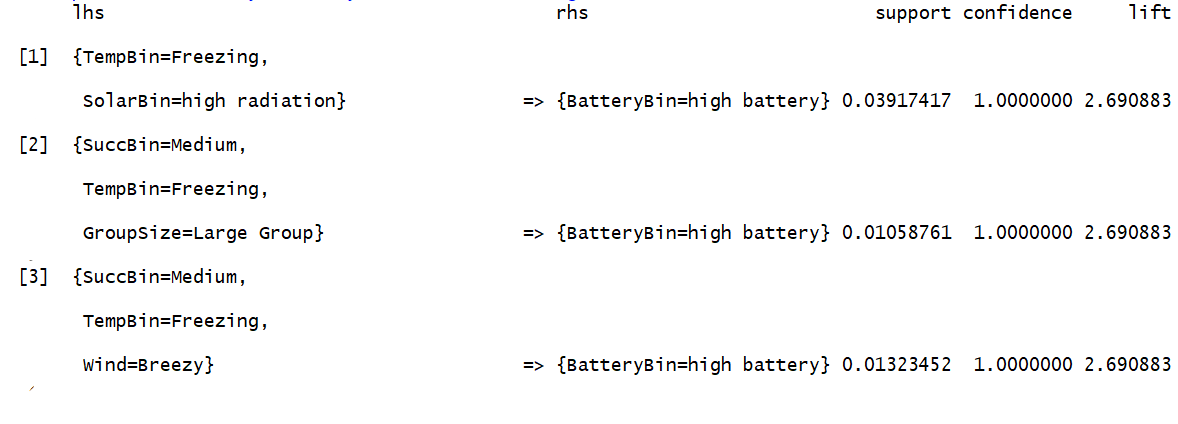
Figure 8 - Model 1: Top 3 Rules
Some interesting, though not incredibly useful, rules that came out of the first model also related to a small segment (1.4%) of the data set—For both the Gibralter Ledges and Ringham Directge routes (with low success and high radiation respectively), GroupSize resulted in “Small Group” with a high confidence. This is insight that could be derived from further exploratory analysis, showing certain routes that won’t allow large groups, likely due to the technical work required to climb it. (Figure 9)

Figure 9 - Model 1: Small Group Routes
Second Model:
The second model is the one that most directly answers our “business question:” what conditions would lead to the strongest likelihood of successfully summitting Mount Rainier?
In this case no rules arose out of our hyperparemeters. For this reason we lowered the necessary support to .5% of cases, and lowered out confidence to just 60%. Under these conditions there were only two rules that arose (Figure 10).

Figure 10 - Model 2: Results
Third Model:
The third model answers our business question indirectly, rather than being of use to mountaineers looking for a specific route and weather conditions to attempt a climb, these rules can be used to determine which routes and days they should not climb—less helpful but still important. Only 5 rules came out of this model that met our hyperparameters, and out of those only 3 are useable by mountaineers. (Figure 11)

Figure 11 - Model 3: Results
For the rules which have a LHS containing “glacier only – no summit attempt” the resulting low success fits with common sense. The routes of glacier only are cases where mountaineers simply climbed on the glacier and did not attempt to summit—thus becoming useless in our business question for those mountaineers who may be interested in summiting Mount Rainier.
For two of the remaining rules some useful information arises, on Fuhrers Finger and Gibralter Ledges, climbing in a small group correlated strongly (~92% confidence) with low success. It is important to note that the smaller the group, the more likely the success percentage would either be closer to 100% or 0%, because less people make up the attempts and successes.
The final rule, high battery on Fuhrers Finger, indicates a more complex analysis. Battery voltage is negatively correlated to temperature and relative humidity, which have already been shown in the correlation matrix (at least for temperature) to be correlated to success rate. This could be used by mountaineers as an indicator of when not to climb Fuhrers Finger, as it may be a route that gets icier than others under low temperature and high humidity.
Conclusion:
In conclusion, this analysis did not result in strong hard-and-fast rules for when and where to climb Mount Rainier. The correlation matrix showed the most directly useable results from the offset, before any machine learning algorithms were implemented: high solar radiation correlated to a higher likelihood of a successful summit. The association rules reinforced this simple yet useable answer to our business question, specifically for the routes Ringhram Directge and Tahoma, though with only a ~60% confidence on a small percentage of the data set, we would not advise mountaineers to climb Rainier based solely on these factors.
Overall it is clear that, as with many sports, individual skill and preparation factor just as much, if not more, into the likelihood of a successful summit as weather conditions and the route chosen. One other rule that arose in our third model also speaks to another factor to consider before attempting to climb a mountain: climb in a larger group. Climbing certain routes in a small group resulted in low success rates, and generally, climbing with more people is a safer choice.
Parts of this analysis may have muddied the waters of confidence given how many weather variables were interrelated: solar radiation and temperature are strongly correlated (see Figure 4), as are battery voltage, relative humidity, and temperature.
Appendix 1: Data
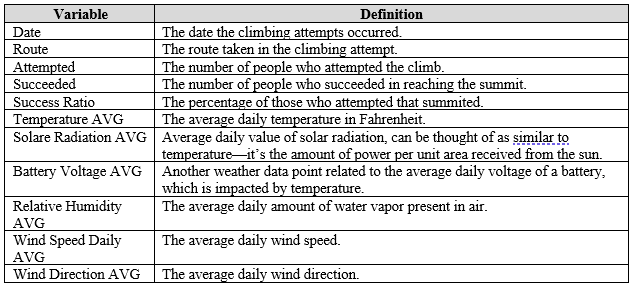
Data Sources & Dictionary:
Mt. Rainier Climbing Statistics: https://www.kaggle.com/codersree/mount-rainier-weather-and-climbing-data (taken from the Mount Rainier National Park Climbing and Mountaineering Site, part of the National Park Service)
Mt. Rainier Weather Data: https://www.kaggle.com/codersree/mount-rainier-weather-and-climbing-data (taken from the North West Avalanche Center)
Appendix 2: Feature Frequency